Stroop Effect - Testing a Perceptual Phenomenon
Udacity Data Analyst Nanodegree
Project Overview
In this project, you will investigate a classic phenomenon from experimental psychology called the Stroop Effect. You will learn a little bit about the experiment, create a hypothesis regarding the outcome of the task, then go through the task yourself. You will then look at some data collected from others who have performed the same task and will compute some statistics describing the results. Finally, you will interpret your results in terms of your hypotheses.
Find the spreadsheet with the calculations here: https://docs.google.com/spreadsheets/d/194Vc8K5SPjlEYZL97j4oDCDcvbP2ZrwNA6rtQ4NVMKQ/edit?usp=sharing
1. What is our independent variable? What is our dependent variable?
Independent: the words condition (congruent or incongruent); Dependent: the time it takes to name the ink colors.
2. What is an appropriate set of hypotheses for this task? What kind of statistical test do you expect to perform? Justify your choices.
Null hypothesis (H0): The mean time for the population to name the ink colors is equal for the Congruent and Incongruent conditions (μC = μI);
Alternative Hypothesis (H1): The mean time for the population to name the ink colors is different for the Congruent and Incongruent conditions (μC = μI);
We expect to perform a paired t-test, because: - We assume the distributions are normal; - The two samples are dependent; - We do not know the population’s standard deviation; - The samples size is below 30.
3. Report some descriptive statistics regarding this dataset. Include at least one measure of central tendency and at least one measure of variability.
Mean difference: -7.96 Standard deviation of the difference: 4.86 Standard error of the mean difference: .99
4. Provide one or two visualizations that show the distribution of the sample data. Write one or two sentences noting what you observe about the plot or plots.
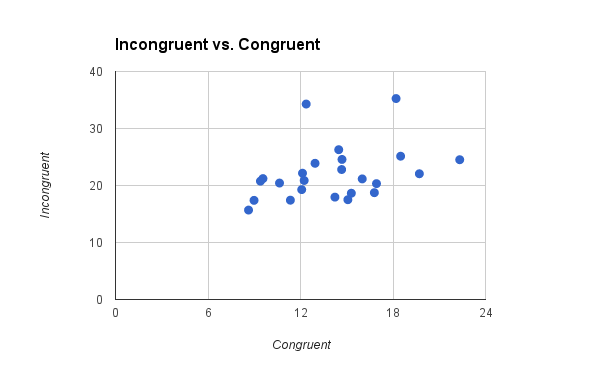 The scatter plot shows some degree of correlation between the two samples.
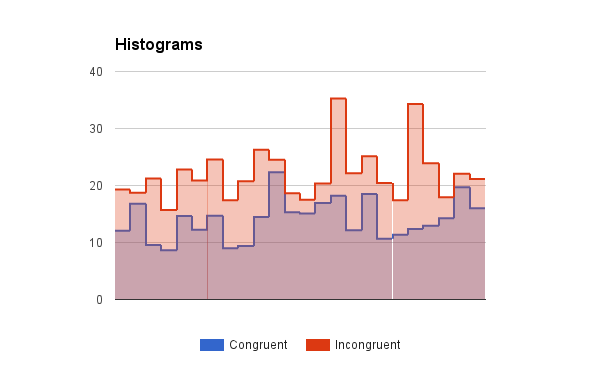 The histograms show that the times on the incongruent sample are larger than on the congruent sample.
5. Now, perform the statistical test and report your results. What is your confidence level and your critical statistic value? Do you reject the null hypothesis or fail to reject it? Come to a conclusion in terms of the experiment task. Did the results match up with your expectations?
Confidence level = 99%
Alpha = .01
t-critical two-tailed = +-2.807
t-statistic = -8.021
r² = .737
Our t-statistic is less than the negative t-critical (-8.021 < -2.807) so we reject the null hypothesis.
This result means that the difference between the congruent and incongruent samples is statistically significant. Based on our r², 73.7% of this difference is due to the words condition (congruent or incongruent). The results match my expectations.
6. Optional: What do you think is responsible for the effects observed? Can you think of an alternative or similar task that would result in a similar effect? Some research about the problem will be helpful for thinking about these two questions!
Since understanding the meaning of words is an automatic process as a result of habitual reading, and recognizing colors is not, the brain spends attentional resources on it, interfering with the color recognition. A similar experiment could be to show up or down arrows, randomly above or below a central point (incongruent), and compare it to showing up arrows above and down arrows below a central point (congruent).